TEveEventDisplay: Difference between revisions
No edit summary |
|||
| (10 intermediate revisions by the same user not shown) | |||
| Line 15: | Line 15: | ||
The TEveEventDisplay is driven using the ART module "TEveEventDisplay_module." This is an ART Analyzer and can be used in the same was as a regular ART Analyzer. | The TEveEventDisplay is driven using the ART module "TEveEventDisplay_module." This is an ART Analyzer and can be used in the same was as a regular ART Analyzer. | ||
The User can select which Data Products are displayed and the Instances to display by editing the FCL parameters which are input to the Collection Filler. These are listed with default values in the TEveEventDisplay prolog.fcl. The base | The User can select which Data Products are displayed and the Instances to display by editing the FCL parameters which are input to the Collection Filler. These are listed with default values in the TEveEventDisplay prolog.fcl. The base instance is: | ||
<code> | <code> | ||
| Line 51: | Line 51: | ||
* <code>add</code>: To add a specific object to the display change these to true | * <code>add</code>: To add a specific object to the display change these to true | ||
* <code>particles</code>: PDG code for MCTrajectories which user wants to display | * <code>particles</code>: PDG code for MCTrajectories which user wants to display | ||
* <code>accumulate</code>: The accumulate function allows the user to collect several events in the display. This might be useful to understand rates e.g. in Cosmics passing through for alignment | |||
A number of examples are included in the TEveEventDisplay package. These are in the CallerFclExamples directory. To run form example on the output of a reconstructed CeEndpoint job made using JobConfig scripts (primary/digitize/reco outcome): | A number of examples are included in the TEveEventDisplay package. These are in the CallerFclExamples directory. To run form example on the output of a reconstructed CeEndpoint job made using JobConfig scripts (primary/digitize/reco outcome): | ||
| Line 66: | Line 67: | ||
[[File:gui.png]] | [[File:gui.png]] | ||
In this example we see MCTrajectories in red, Kalman fit in green (underneath the MC), CaloCluster in pink (energy proportional colouring), ComboHits (zoom in to see in green), Straws hit (lines shown in range of colours, user can click to see ID of panel/plane/straw info). | |||
* You can rotate and zoom using your mouse. Note that the label corresponds to the SimParticles so cannot ID reco products. | * You can rotate and zoom using your mouse. Note that the label corresponds to the SimParticles so cannot ID reco products. | ||
| Line 77: | Line 80: | ||
The calorimeter 2D display has two XY views. One for each disk. Outlines of crystals and CaloClusters are shown. | The calorimeter 2D display has two XY views. One for each disk. Outlines of crystals and CaloClusters are shown. | ||
The tracker display shows XY and XZ projections. The straws are coloured and projected on the 2D and 3D displays. Labels tell the user more information. | The tracker display shows XY and XZ projections. The straws are coloured and projected on the 2D and 3D displays. Labels tell the user more information. The Stopping Target is also shown in the XZ view this is useful for MCTrajectory viewing. Each foil is shown and Tracker planes are also shown explicitly. | ||
* Attempt to go to a specific event by entering the run and event number and selecting "Go". | * Attempt to go to a specific event by entering the run and event number and selecting "Go" or flick through events using the arrows. | ||
* You can choose events in a specific time window or energy range. Note to warnings if you do something unphysical: | * You can choose events in a specific time window or energy range. Note to warnings if you do something unphysical: | ||
| Line 96: | Line 99: | ||
[[File:label.png]] | [[File:label.png]] | ||
== Example of Mixed CeEndpoints with CRV backgrounds == | |||
* A Mixed CeEndpoint sample can be configured using the MDC2020 scripts (gen_Mix.sh with CeEndpoint option) | |||
* These contain neutrons and other "noise" events in the CRV | |||
* The CRV can be visualized by setting ```addCRV``` to true. This will also display 2 2D projections too. | |||
[[File:CRV.png]] | |||
== Example of PS and TS Trajectories == | |||
* The user may want to view events in the PS and TS. For example the output of the JobConfig/beam/POT_MCTrajectory.fcl. | |||
* Using the upstream instance: | |||
[[File:upstream1.png]] | |||
[[File:upstream2.png]] | |||
== Resources == | == Resources == | ||
| Line 101: | Line 126: | ||
* Root TEve Examples : https://root.cern.ch/root/html608/group__tutorial__eve.html | * Root TEve Examples : https://root.cern.ch/root/html608/group__tutorial__eve.html | ||
* Alice EVE - a very useful example of a nice TEve based Event Display: https://github.com/alisw/AliRoot/tree/master/EVE/EveBase | * Alice EVE - a very useful example of a nice TEve based Event Display: https://github.com/alisw/AliRoot/tree/master/EVE/EveBase | ||
== Developers == | |||
This code has mostly been written by Sophie Middleton (Caltech) with help from Aditi Venkatesh (Caltech) and Namitha Chitrazee (Pisa). | |||
== Contact == | == Contact == | ||
If you are interested in getting involved or want further information about the TEveEventDisplay please contact Sophie Middleton. | |||
Latest revision as of 21:25, 29 September 2021
The Mu2e TEveEventDisplay
EVE is the Event Visualization Environment within ROOT. It is used extensively in HEP. EVE provides an application framework for the construction of event-display programs and is built on top of ROOT's GUI, GL and GED infrastructure allowing it to easily integrate with the existing Mu2e Framework. TEve GUI interface allows the users to view the geometry and tracks in interactively and zoom in on and rotate interesting features.
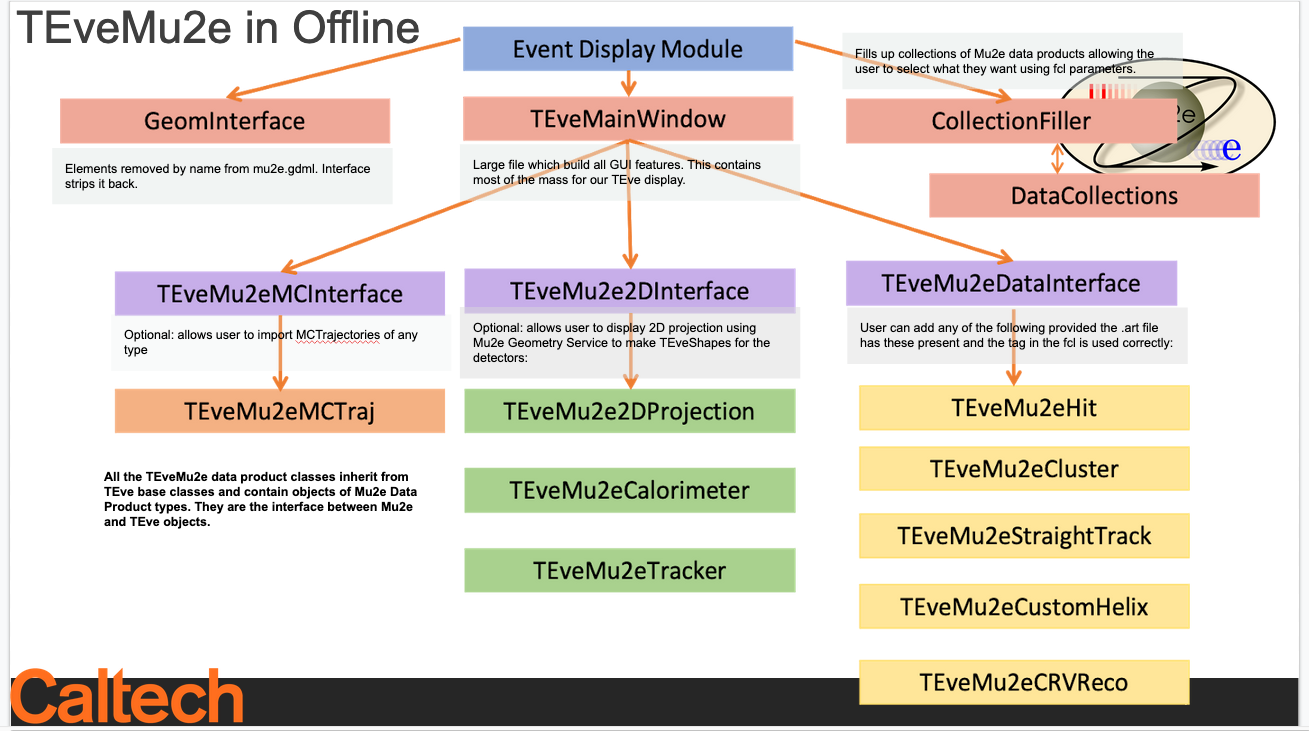
Within Mu2e a TEve based Event Display has been developed. It resides in the TEveEventDisplay directory.
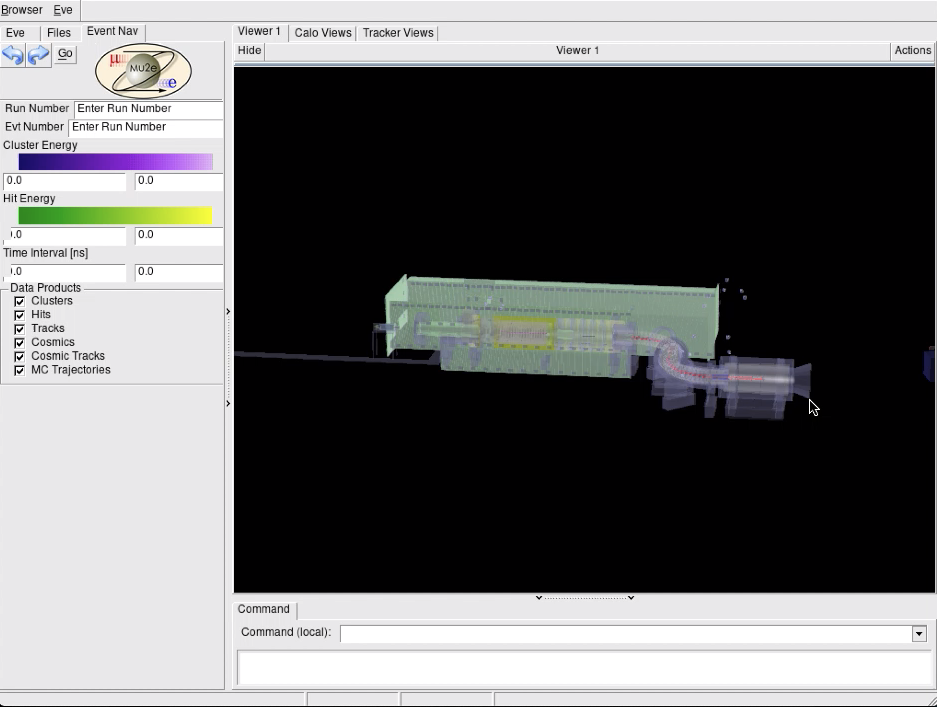
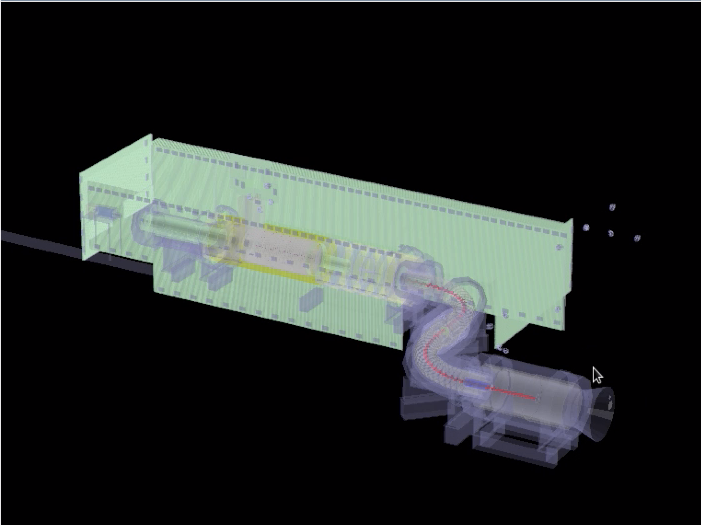
The display allows 3D graphics rendering based on the Mu2e GDML. The user has control as to which aspects of Mu2e can be displayed .i.e PS, TS, DS, CRV are optional. The user can also control which data products are displayed. In addition to the 3D display, a 2D projection of the Tracker (in XZ and XY) and Calorimeter (2 disks in XY) is also provided.
Code Structure
Using The Mu2e TEveEventDisplay
The TEveEventDisplay is driven using the ART module "TEveEventDisplay_module." This is an ART Analyzer and can be used in the same was as a regular ART Analyzer.
The User can select which Data Products are displayed and the Instances to display by editing the FCL parameters which are input to the Collection Filler. These are listed with default values in the TEveEventDisplay prolog.fcl. The base instance is:
   module_type : TEveEventDisplay
   accumulate : false
   showCRV : false
   showBuilding : false
   showDSOnly : true
   showEvent : true
   isMCOnly : false
   filler : {
     ComboHitCollection        : "makeSH"
     CrvRecoPulseCollection	:  "CrvRecoPulses"
     CosmicTrackSeedCollection :  NULL
     CaloClusterCollection     :  "CaloClusterMaker"
     CaloHitCollection         :  NULL
     HelixSeedCollection       :  "HelixFinderDe:Negative"
     KalSeedCollection         :  ["KFFDeM"]
     TrkExtTrajCollection      : NULL
     MCTrajectoryCollection    :  "compressDigiMCs"
     addHits 			: true
     addTracks 		: true
     addCrvHits		: true
     addCosmicSeedFit	        : false
     addClusters		: true
     addTrkExtTrajs		: false
     addMCTraj			: true
   }
 particles :   [11,13,2212,2112,211,22,212]
where
showCRV,showBuilding,showDSOnlyCRV: These refer to the 3D geometry and talk to the GeomInterface, which adds or removes geometry objects from the display.Collections: These refer to Mu2e Data Products, set the instance names to correspond to your own .art dataadd: To add a specific object to the display change these to trueparticles: PDG code for MCTrajectories which user wants to displayaccumulate: The accumulate function allows the user to collect several events in the display. This might be useful to understand rates e.g. in Cosmics passing through for alignment
A number of examples are included in the TEveEventDisplay package. These are in the CallerFclExamples directory. To run form example on the output of a reconstructed CeEndpoint job made using JobConfig scripts (primary/digitize/reco outcome):
mu2e -c TEveEventDisplay/CallerFclExamples/helix_example.fcl CeEndpoint-reco.art
The user may want to view MCTrajectories in the PS and/or TS. To do this use the upstream instance and ensure that you update the fcl instance to match the tag in your .art file.
TEveEvent Display: A Reconstructed CeEndpoint (including the MCTrajectories)
To reproduce:
- Run JobConfig files for a CeEndpoint: primary/CeEndpoint, digitize/OnSpill and reco/Reco.fcl. To see the MCTrajectories make sure you have these switched on in the fcls.
- Run the TEveEventDisplay using above instructions
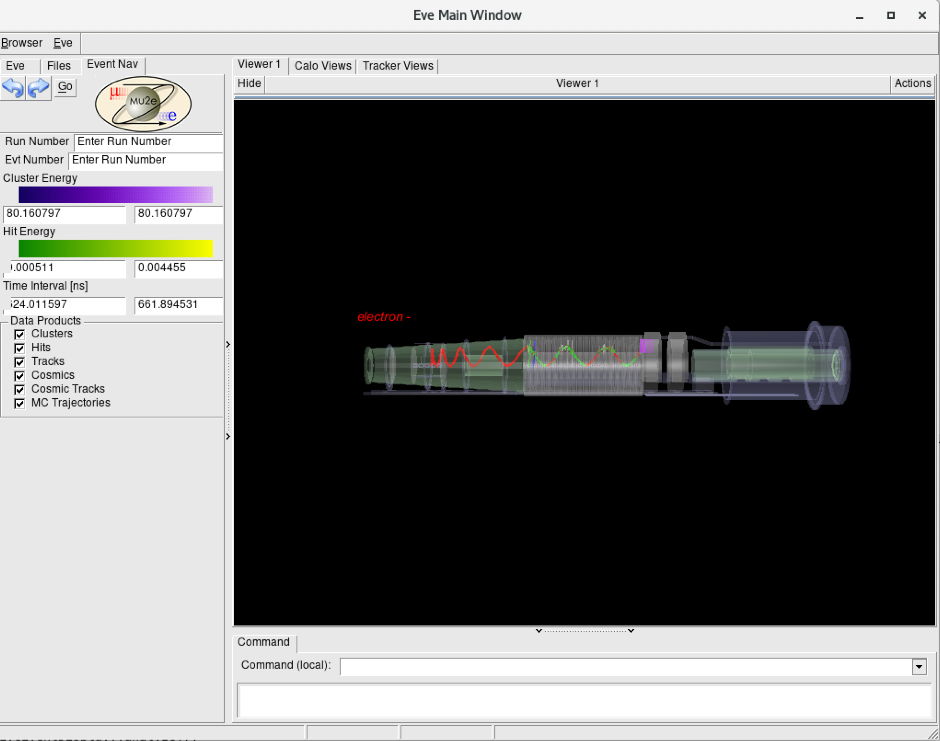
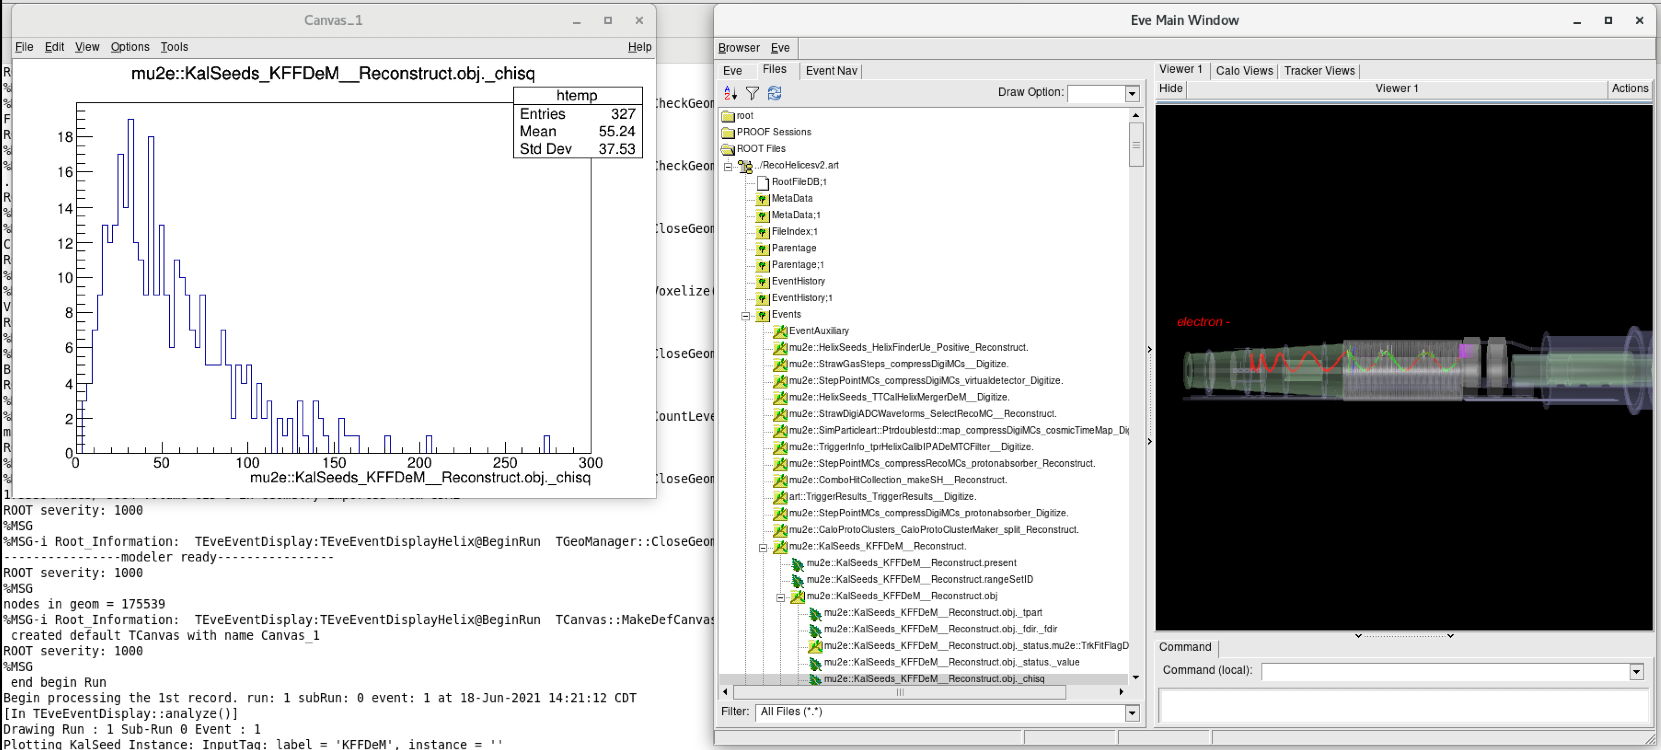
- GUI will appear:
In this example we see MCTrajectories in red, Kalman fit in green (underneath the MC), CaloCluster in pink (energy proportional colouring), ComboHits (zoom in to see in green), Straws hit (lines shown in range of colours, user can click to see ID of panel/plane/straw info).
- You can rotate and zoom using your mouse. Note that the label corresponds to the SimParticles so cannot ID reco products.
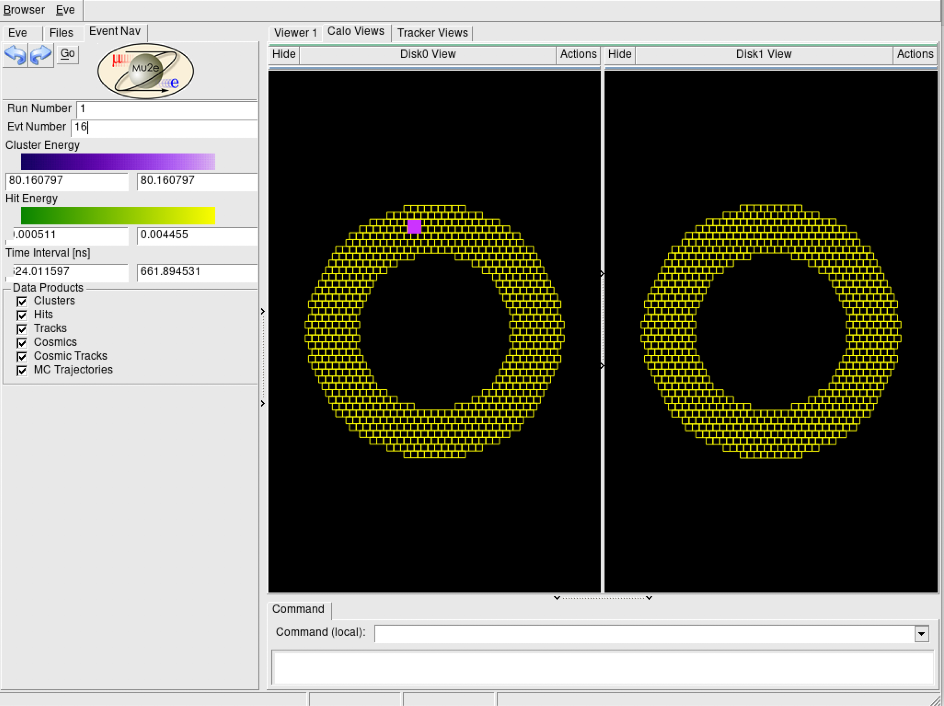
- You can also view the 2D projections using the tabs:
The calorimeter 2D display has two XY views. One for each disk. Outlines of crystals and CaloClusters are shown.
The tracker display shows XY and XZ projections. The straws are coloured and projected on the 2D and 3D displays. Labels tell the user more information. The Stopping Target is also shown in the XZ view this is useful for MCTrajectory viewing. Each foil is shown and Tracker planes are also shown explicitly.
- Attempt to go to a specific event by entering the run and event number and selecting "Go" or flick through events using the arrows.
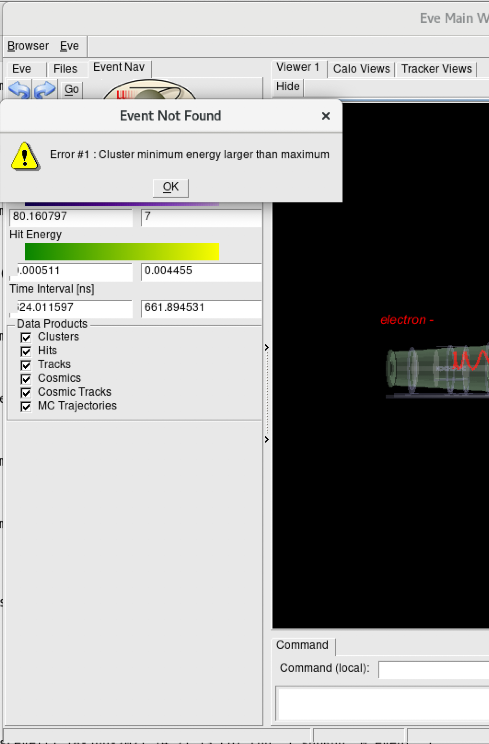
- You can choose events in a specific time window or energy range. Note to warnings if you do something unphysical:
- To view the corresponding .art data:
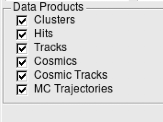
- To add or remove a product use the check boxes
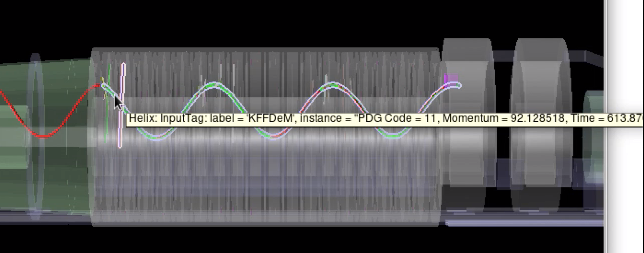
- To get more information about something scroll the mouse over it:
Example of Mixed CeEndpoints with CRV backgrounds
- A Mixed CeEndpoint sample can be configured using the MDC2020 scripts (gen_Mix.sh with CeEndpoint option)
- These contain neutrons and other "noise" events in the CRV
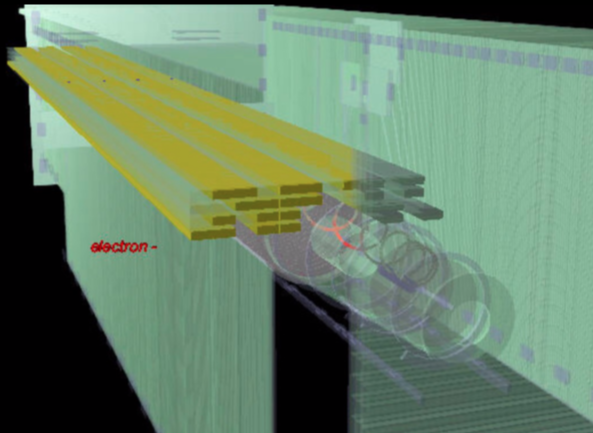
- The CRV can be visualized by setting ```addCRV``` to true. This will also display 2 2D projections too.
Example of PS and TS Trajectories
- The user may want to view events in the PS and TS. For example the output of the JobConfig/beam/POT_MCTrajectory.fcl.
- Using the upstream instance:
Resources
- TEve : https://root.cern.ch/eve
- Root TEve Examples : https://root.cern.ch/root/html608/group__tutorial__eve.html
- Alice EVE - a very useful example of a nice TEve based Event Display: https://github.com/alisw/AliRoot/tree/master/EVE/EveBase
Developers
This code has mostly been written by Sophie Middleton (Caltech) with help from Aditi Venkatesh (Caltech) and Namitha Chitrazee (Pisa).
Contact
If you are interested in getting involved or want further information about the TEveEventDisplay please contact Sophie Middleton.
