EventDisplays: Difference between revisions
| Line 18: | Line 18: | ||
==Stntuple 2-D== | ==Stntuple 2-D== | ||
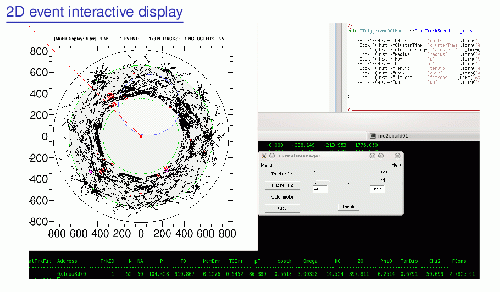
[[File:Stntuple 2D Display.gif |thumb|500px|alt=Stntuple 2-D event display|Example of the Stntuple 2-D display.]] | [[File:Stntuple 2D Display.gif |thumb|500px|alt=Stntuple 2-D event display|Example of the Stntuple 2-D display.]] | ||
The [https://fermicloud.sharepoint.com/sites/Stntuple Stntuple] ntuple package includes also a module named < | |||
The [https://fermicloud.sharepoint.com/sites/Stntuple Stntuple] ntuple package includes also a module named <code>MuHitDisplay</code> that provides a 2D event display. By default, the module pops up a canvas with the Tracker X-Y and calorimeter views where are displayed: | |||
* the reconstructed straw hits: black crosses | |||
* the calorimeter clusters: red/magenta circles (red for those on the disk closer to the tracker) where the size is proportional to the reconstructed energy | |||
* reconstructed tracks: blu line | |||
An additional controller canvas allow to exploit additional views of the detectors: | |||
* Tracker: XY transverse and R-Z longitudinal | |||
* Calorimeter XY | |||
* Cosmic Ray Veto | |||
=== How to run Stntuple 2-D=== | |||
To run this event display the user needs to add the instance of the <code>MuHitDisplay</code> in the <code>fcl</code> file in the <code>physics.filters</code> block and execute it in the end of the <code>trigger_path</code>. On the <code>Stntuple/fcl/prolog.fcl</code> an example of <code>MuHitDisplay</code> instance block is available. | |||
This package is maintained by [mailto:murat@fnal.gov P. Murat] and [mailto:gianipez@fnal.gov G. Pezzullo]. | This package is maintained by [mailto:murat@fnal.gov P. Murat] and [mailto:gianipez@fnal.gov G. Pezzullo]. | ||
Revision as of 08:39, 21 November 2017
Here are two event displays and a geometry display. Pasha Murat is also working on a display based on the root TEve package. These are all informal efforts. It is a long-term plan to adopt, formalize and support one event display.
Geometry Browser
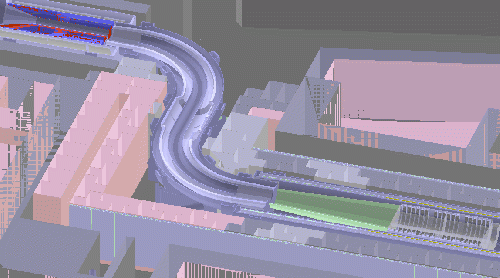
This system displays the geometry built as part of the geant model of the detector. It does not display events. It has options for cutaways, as seen in the example. It also has the option to make some volumes transparent.
EventDisplay
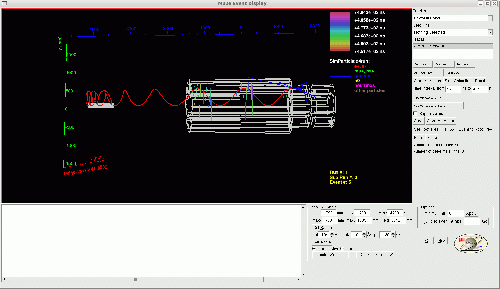
A display system from Ralf Ehrlich. Run from a module:
mu2e -c EventDisplay/test/EventDisplay.fcl -s ..
Controls are in the display and quite intuitive. See also doc-7905 and doc-2371
Stntuple 2-D
The Stntuple ntuple package includes also a module named MuHitDisplay that provides a 2D event display. By default, the module pops up a canvas with the Tracker X-Y and calorimeter views where are displayed:
- the reconstructed straw hits: black crosses
- the calorimeter clusters: red/magenta circles (red for those on the disk closer to the tracker) where the size is proportional to the reconstructed energy
- reconstructed tracks: blu line
An additional controller canvas allow to exploit additional views of the detectors:
- Tracker: XY transverse and R-Z longitudinal
- Calorimeter XY
- Cosmic Ray Veto
How to run Stntuple 2-D
To run this event display the user needs to add the instance of the MuHitDisplay in the fcl file in the physics.filters block and execute it in the end of the trigger_path. On the Stntuple/fcl/prolog.fcl an example of MuHitDisplay instance block is available.
This package is maintained by P. Murat and G. Pezzullo.
From Pasha Murat and Giani Pezzullo as part of the Stntuple ntuple package.
Good for detailed examination of tracks and hits. See also doc-13916.
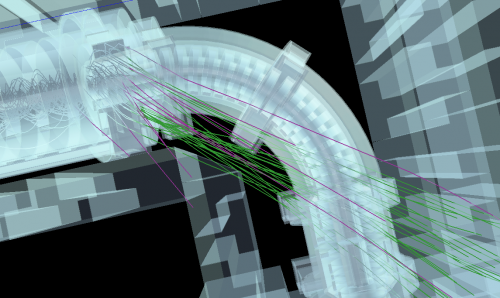
root Eve
Pasha Murat is working on a display based on TEve package (2017).


