EventDisplays
This page details past and present event displays and a geometry display. Sophie Middleton is co-ordinating the current Event Display effort, there are several forms of Event Display currently usable, each is described below:
Geometry Browser
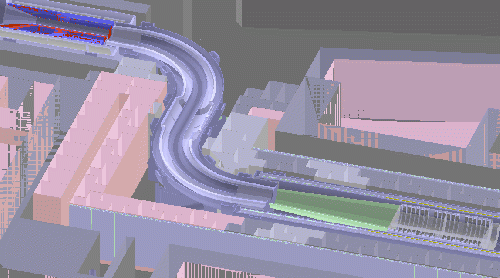
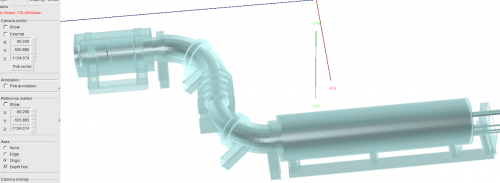
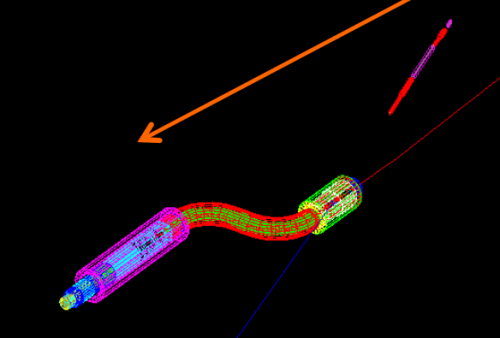
This system displays the geometry built as part of the geant model of the detector. It does not display events. It has options for cutaways, as seen in the example. It also has the option to make some volumes transparent.
This system is ROOT-based and runs on GDML files that can be created by running:
mu2e -c Offline/Mu2eG4/fcl/gdmldump.fcl
You can then write a ROOT macro that reads the GDML file and visualizes the geometry. Example geometry macros are in the Offline repository
If you are running the ROOT macro on a remote machine, you might find the visualization is slow. You can get around this by adding the following line to the start of your macro:
gROOT->SetWebDisplay("server:1234");
and connecting to the remote machine with the port forwarded:
ssh -L 1234:localhost:1234 username@remote.machine
Then, when you run the macro, you will see a web address printed to the terminal. Copy this address to your local web browser and you will have a much smoother and more responsive visualization.
Mu2e/EventDisplay
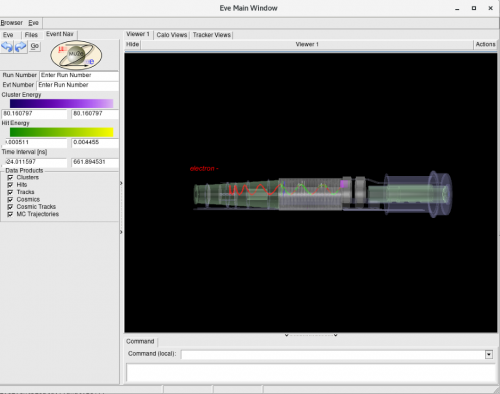
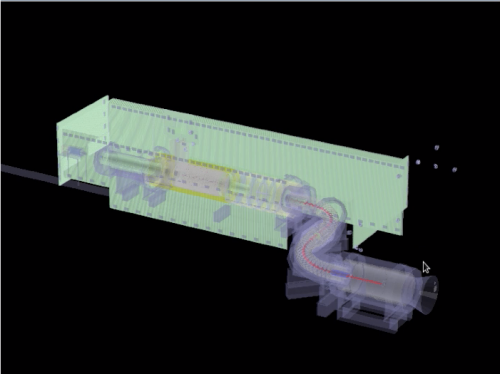
The Analysis Tools Group maintains an REve-based EventDisplay: https://github.com/Mu2e/EventDisplay.
This display contains the ability to visualize the following geometries:
- PS, TS and DS with all details (coils, collimators etc.)
- Detailed view of Production Target
- Cosmic Ray Veto system in nominal and extracted configurations
- Tracker and Calorimeter
- Proton Absorbers in DS
- Detailed view of Stopping Target
Other regions of the Mu2eWorld can be added upon request (contact Analysis Tools Group).
The following DataProducts can be visualized within these geometries:
- MCTrajectories
- Kalman Fit Track
- KalIntersections and SurfaceSteps
- ComboHits/Straw Hits
- Calorimeter Clusters, Crystal Hits and CaloDigis
- CRV Coincidences
The nominal configuration can be found in:
EventDisplay/examples/nominalexample.fcl
A similar example can be found for the extracted configuration.
By defaul the examples allow visualize of all present instances of the above DataProducts. To switch to only those requested the user must use the ```specifyTag``` parameter. Setting that the ```True``` to use only the requested art instances.
The user can also switch off the default set of shown products listed in the .fcl file by setting them to ```False```. The solenoids are not shown by default.
For more details: [1]
Offline/TEveEventDisplay
A detailed TEve based display specialized for Mu2e is available, details are found here: [2].
Offline/EventDisplay
A display system from Ralf Ehrlich. Run from a module:
mu2e -c Offline/EventDisplay/fcl/EventDisplay.fcl -s ..
Controls are in the display and quite intuitive. See also doc-7905 and doc-2371
Stntuple 2-D
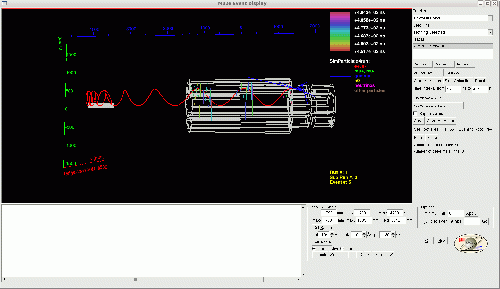
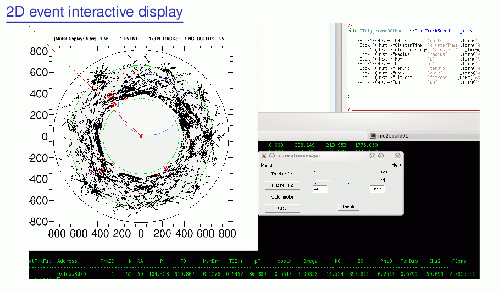
The Stntuple ntuple package includes also a module named MuHitDisplay that provides an interactive 2D event display. By default, the module pops up a canvas with the Tracker X-Y and calorimeter views where are displayed:
- the reconstructed straw hits: black crosses
- the calorimeter clusters: red/magenta circles (red for those on the disk closer to the tracker) where the size is proportional to the reconstructed energy
- reconstructed tracks: blu line
In addition to that, the module prints put the information of the reconstructed tracks.
An additional controller canvas allows to exploit additional views of the detectors:
- Tracker: XY transverse and R-Z longitudinal
- Calorimeter XY
- Cosmic Ray Veto
The calorimeter and the tracker views allow the user to select a specific "Time Cluster" that was reconstructed in the event to seed the track search.
Tracker XY and RZ views
The two sets of event projection for the tracker (X-Y and R-Z) provide a complete representation of the reconstructed tracks within a given event. Both canvas allow to zoom specific region inside the canvas. The RZ view include also
Calorimeter XY view
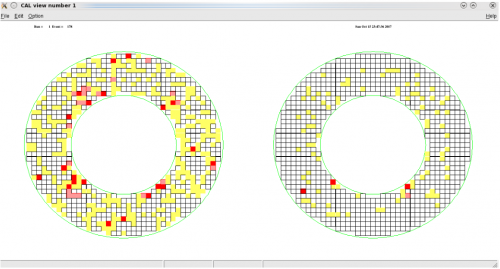
The calorimeter XY view includes both disks. Each crystal is colored with a red-yellow proportional to the energy reconstructed. The right button of the cursor allows to inspect the crystal-hit information and have them printed in the Terminal.
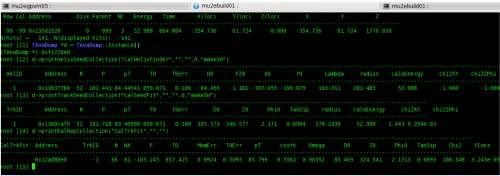
This event display allows to inspect all the collection of reconstructed objects given in the Event. MuHitDisplay is run in interpreted mode within ROOT. To print all the informations we need we use the Class Stntuple/mod/TAnaDump.cc . An example of working flow follows:
d=TAnaDump::Instance(): this command instantiate a pointer to a TAnaDump objectd->print...: now the user is ready to print out all the collection he wants! The only arguments necessary to use theprint...functions are the name of the module instances.
Stntuple 2-D
To run this event display the user needs to add the instance of the MuHitDisplay in the fcl file in the physics.filters block and execute it in the end of the trigger_path. On the Stntuple/fcl/prolog.fcl an example of MuHitDisplay instance block is available.
This package is maintained by P. Murat and G. Pezzullo.
From Pasha Murat and Giani Pezzullo as part of the Stntuple ntuple package.
Good for detailed examination of tracks and hits. See also doc-13916.
Old TEve Displays
Pasha Murat has a working geometry display based on gdml and the Stntuple package. Stntuple directions
Pasha Murat is also working on a display for art file based on TEve package (2017).
geant4 qt Event Display
Best document is a Krzysztof Genser's talk here: doc 3680.
This rather powerful tool is setup to mainly show the details of geometry and possibly tracks of one event, but not any reconstructed quantities.
You must a build a personal version of Offline, and use the g4vis=qt g4mt=off trigger=off buildopts settings:
./buildopts --g4vis=qt --g4mt=off --trigger=off
Calorimeter Disk Histograms
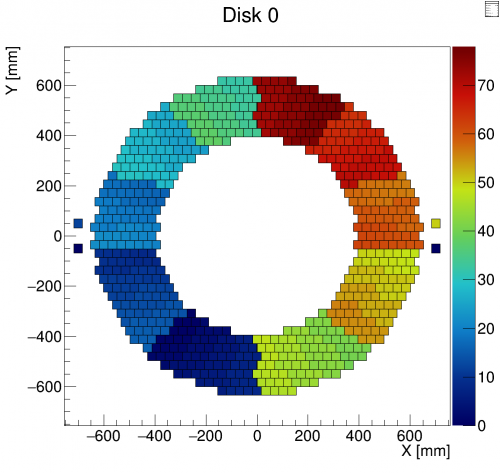
A ROOT-like library named THMu2eCaloDisk exists in Offline/CaloVisualizer with the goal of having simple and portable calorimeter disk histograms that behave like ROOT TH2 ones. Key features:
- Each bin knows hardware information of the crystal and the two left/right channels
- The bin content shown at
Draw()time can be chosen from combinations of the left and right channels: (left, right, sum, difference, average, asymmetry, custom formula).
Code Example
mu2e::THMu2eCaloDisk* h_disk0 = new mu2e::THMu2eCaloDisk("h_disk0","Disk 0",0);
h_disk0->FillOffline(sipmId,3.14);         //Fill values according to channel Offline ID
h_disk0->FillRaw(board,channel,value);     //Fill values according to DIRAC board and channel numbers
h_disk0->SetCombineMode(kAverage);         //Choose the left/right channel combination to be displayed
h_disk0->SetCombineMode("(R<0.1)?0:L/R");  //Custom formula for channel combination
h_disk0->Draw("colzl");                    //Draw color levels and crystal contours
Use in art modules
To produce THMu2eCaloDisk hists in your art analyzer, just add:
#include "Offline/CaloVisualizer/inc/THMu2eCaloDisk.hh"
in your module and:
LIBRARIES REG
  Offline::CaloVisualizer
  Offline::CaloVisualizer_dict
in the CMakeLists.txt cet_build_plugin block of your analyzer.
Full documentation
You can find full documentation of the library functions in the GitHub README file.
