CodeDepencyGraph
Instructions to make a code dependency graph.
These instructions will only work on machines that have ack and graphviz installed.
These instructions describe how to run code-dep-graph, a tool that creates a graph of compile time dependence relationships between packages. The tools starts from the current working directory and works down from there. This tool has it's own notion of a package which is slightly different from other notions in common use. Roughly speaking any directory that contains code is its own package; if a directory has a subdirectories named inc and src, those names are elided. Here are some examples of packages taken from a recent version of Mu2e Offline: RecoDataProducts, ExtinctionMonitorFNAL/Utilities, ExtinctionMonitorFNAL/Reconstruction; the slash is part of the package name.
code-dep-graph walks the directory tree looking for C++ header and implementation files. It parses these files and extracts the #include directives. It builds the package dependency tree based on the #include directives.
Here is a cookbook to run the tool.
- Make a clean working directory and cd to it.
- Clean checkout. This will be a throw-away copy of the code; don't use a copy with changes you intend to commit and push.
- Optional but highly recommended: remove files that unnecessarily complicate the picture. This includes all modules, which must sit at the top of the dependence hierarchy, and a few directories like Sandbox. This step deletes files, hence the warning about using a throw-away copy. By agreement, test directories have no production code, so ignore them too.
- Discover what versions of cetbulidtools are available. Choose a recent version. As of October 22, 2013 version v7_04_00 is known to work.
- Setup an appropriate version of cetbuildtools.
- Run code-dep-graph from the top directory of Offline. The output is a "dot file" that contains dependency pairs; you can read this file with a text editor. Dot files are the standard format of the graphviz package the syntax is intuitive and you can find documentation online - google graphviz or "dot file format". The text represents a directed graph. The log file is verbose and I have not found anything useful in it if the code is working properly. The sed command removes the redundant "Offline/" everywhere
- The previous step should take ~4 minutes on an unloaded machine with local disks. The names trimmed.dot and trimmed.log are illustrative; they have no meaning.
- Do a transitive reduction of the directed graph and create the reduced directed graph as a png file. A transitive reduction means the following. Suppose that we have 3 packages, A, B, C; also suppose that A depends directly on both B and C, while B depends on C. In the transitive reduction the dependence of A on C will be elided since it is implied by the dependence of A on B. If you don't do this step on Offline, the resulting graph is so busy that it is not readable. The commands dot and tred are part of the graphviz package: https://www.graphviz.org
- If there are loops in the directed graph tred will issue a diagnostic like the following:
- Additional comments on tred
- If there are several loops in the graph, tred will only report the first one that it finds. So you need to fix the problem and iterate until there are no more diagnostics.
- The packages mentioned in the "involves the edge" can sometimes be a few hops from the real problem; so you may need to hunt.
- The output of tred is just another dot file; you can capture it to a file instead of piping to dot.
- If you prefer a format different from png, dot has a lot of options: dot --help
- Sometimes the transitive reduction can be confusing - it's hard to see a dependence that you know should be there. In that case just grep the original dot file and you can verify that the dependence is there.
- Hint: when you are in the process of discovering loops, you can identify the offending edge and hand edit the dot file to remove it; then rerun tred to get the new graph; this is much, much faster than rerunning code-dep-graph.
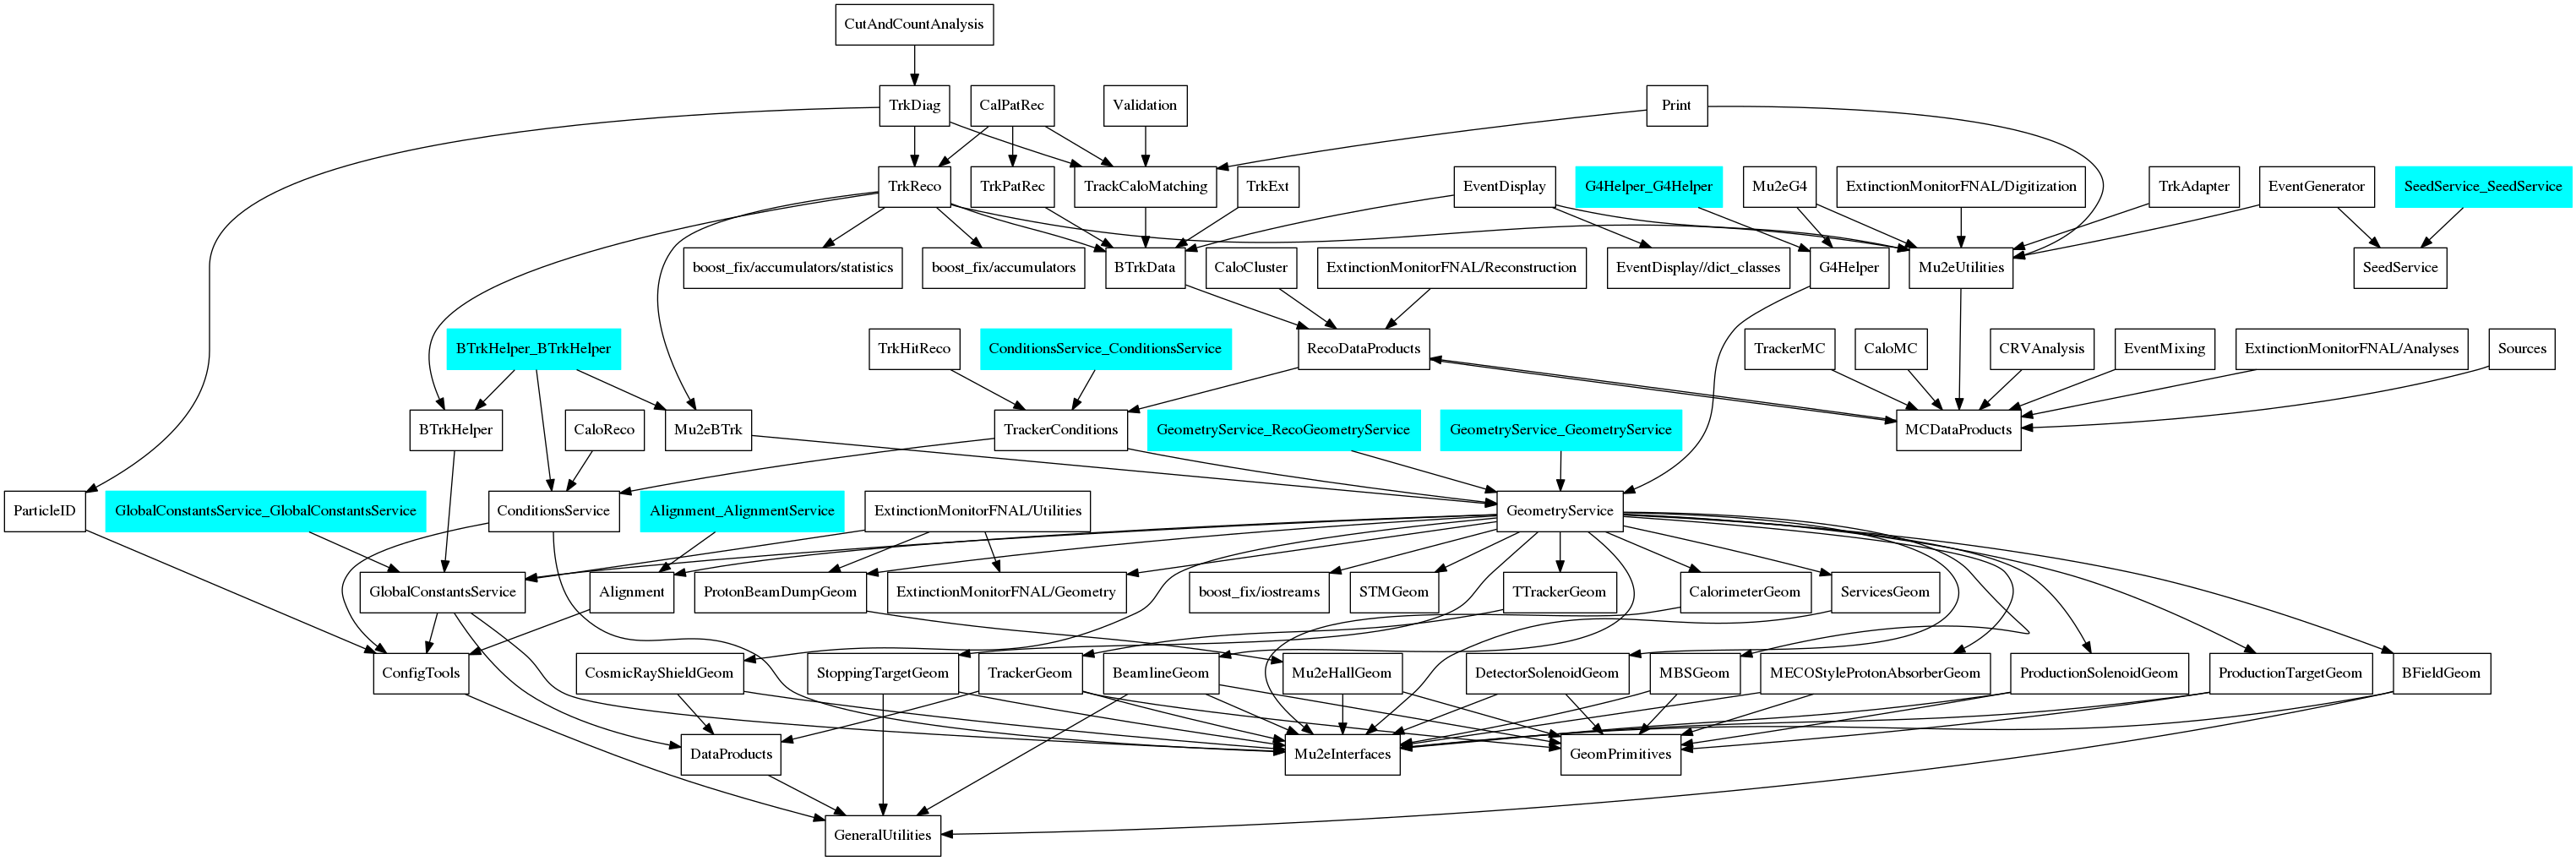
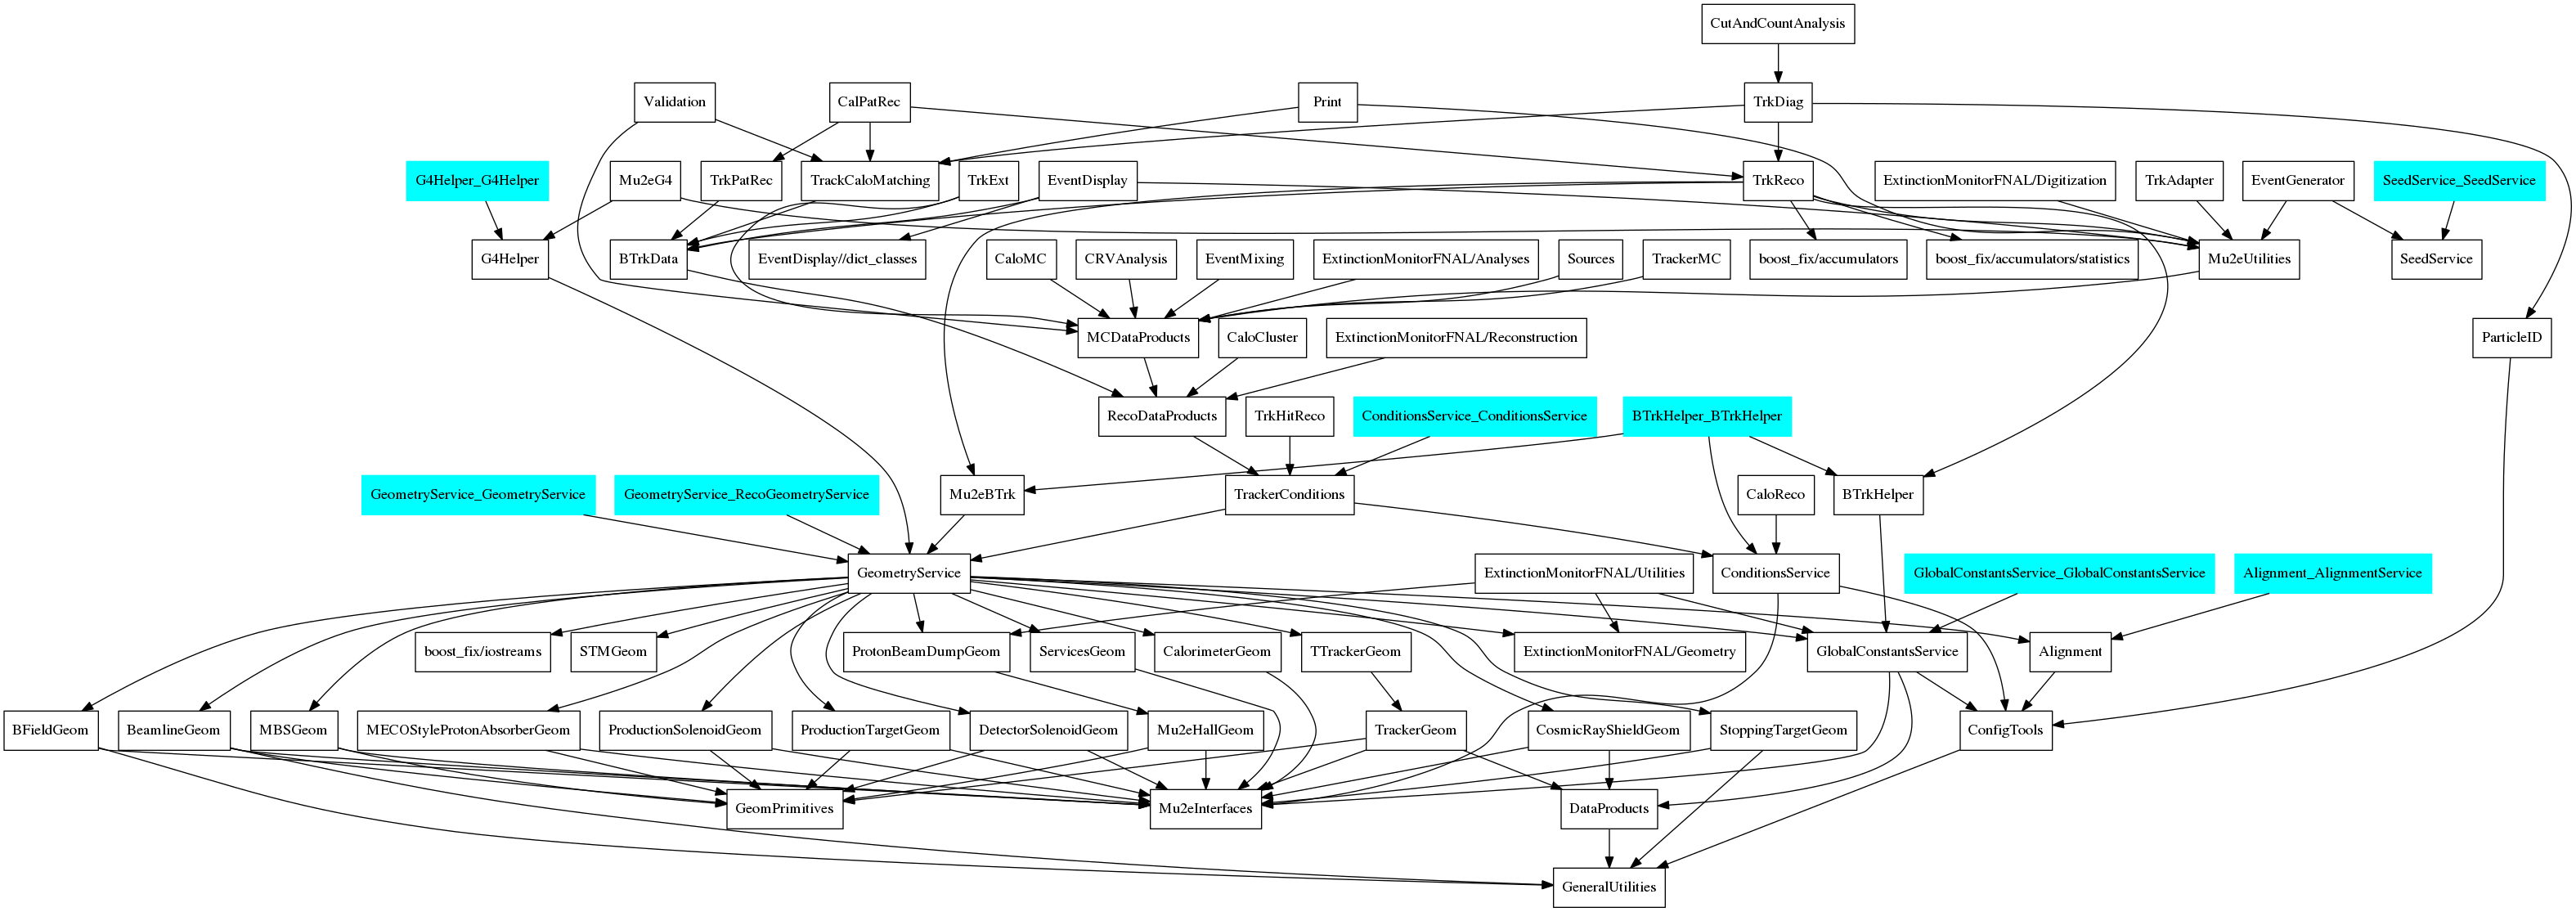
- View the graph using your favorite png browser, such as a web browser, Preview on a Mac, display on SLF, or eog on al9. An example of a dependency graph is here:Media:Trimmed.png. This is taken from the git 5c4868af, from Oct 24, 2018. A revised version of the dependency graph with 1 edge (RecoDataProducts -> MCDataProducts) hand removed from the dot file: Media:Trimmed4.png. This is the edge that will be removed when the one outstanding problem is fixed.
- Some comments on the graph.
- Packages with no dependencies are at the bottom of the graph; packages that have no packages depending on them are at the top.
- code-dep-graph gets a little confused with tools; it forgets to draw a box around the name of the tool plugin; I will speak with the author. This feature is not shown in this figure but it is a known issue.
- A typical service package makes two shared libraries: the service plugin and the library that contains all of the other code in the package. Both are represented in the graph; the service plugin is colored blue and the other library is uncolored.
- One obvious problem with the first graph is that MCDataProducts and RecoDataProducts depend on each other. The problem is understood and has been assigned.
- Optional: create the visualization of the graph without transitive reduction - but it's impossible to read dot trimmed.dot -Tpng -o trimmed_notred.png
mkdir work
cd work
git clone https://github.com/Mu2e/Offline
 find Offline -name \*_module.cc -delete
 find Offline -name \*_source.cc -delete
 find Offline -name \*_tool.cc -delete
 find Offline -name \*_service.cc -delete
 rm -r Offline/Sandbox Offline/HelloWorld
 rm -rf Offline/.git
 rm -rf $(find Offline -maxdepth 2 -type d -name "test")
ups list -aK+ cetbuildtools
 setup ack
 setup cetbuildtools v7_04_00
    or in al9
 spack load cetmodules/xyn2j2a
 spack load ack/x32hbd2
 time ${CETBUILDTOOLS_DIR}/bin/code-dep-graph -v -o trimmed.dot >& trimmed.log
 sed -i 's/Offline\///g' trimmed.dot
 setup graphviz
  (in al9, this is installed as an rpm)
 tred trimmed.dot  | dot -Tpng -o trimmed.png
 warning: %1 has cycle(s), transitive reduction not unique
 cycle involves edge MCDataProducts -> RecoDataProducts